Results
River Groupings
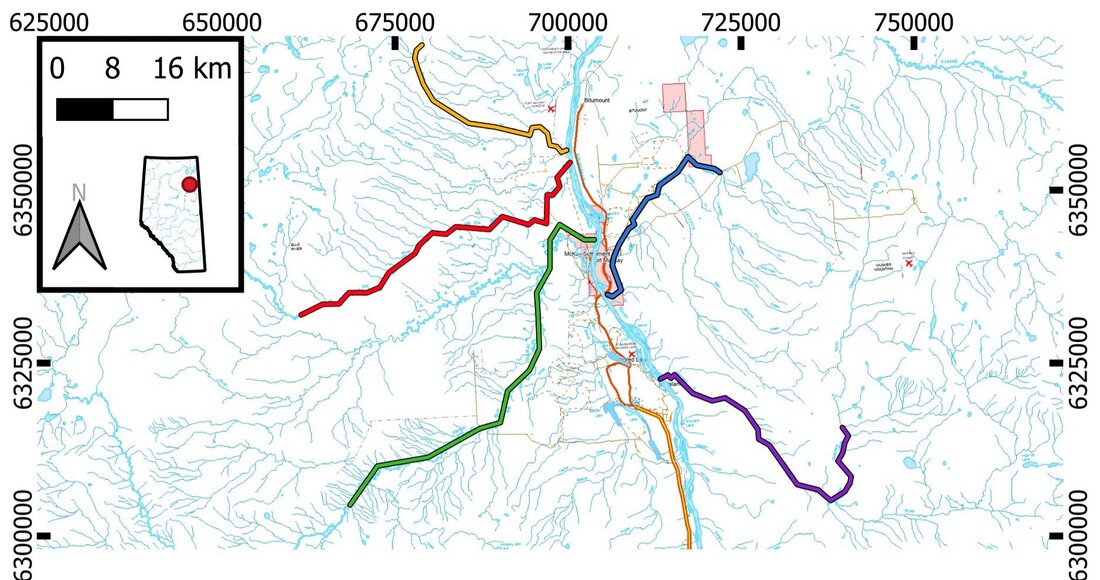

Figure 11. Map of the tributaries to the Athabasca River analyzed as part of this statistical assessment. Colors here match plotting schemes in the two river grouping assessments below.
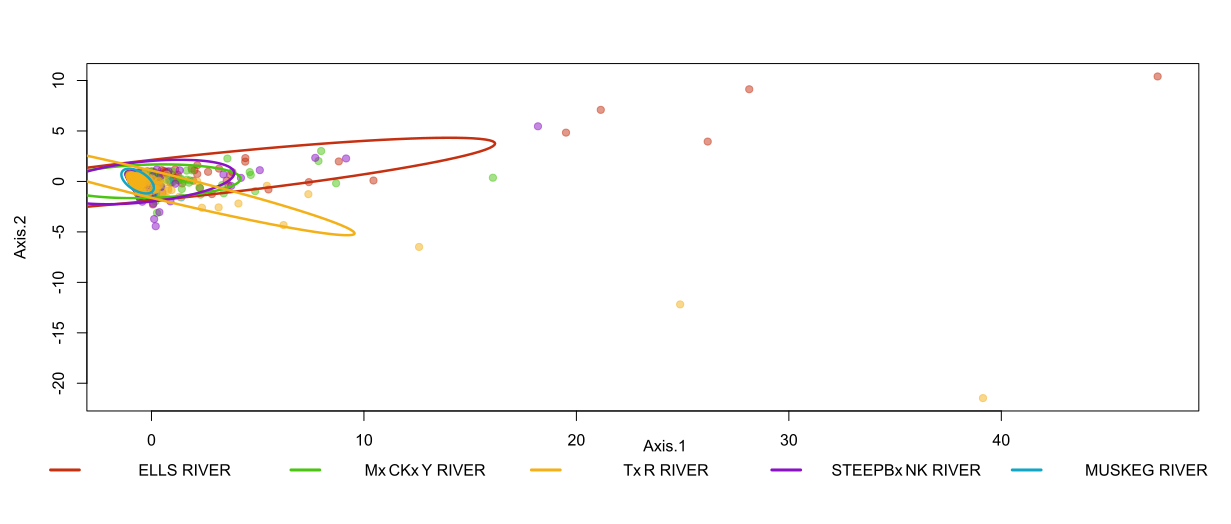
Figure 12. PCOA analysis with ellipses showing 95% confidence intervals of river groupings. The ellipses indicate similar deviations from the standard end member for the Ells, Steepbank, and MacKay Rivers. There is a unique trend for the Tar river with a larger contribution of the lighter C1-C2 chain PAHs.
Groupings were applied for each river system. The ellipses were made with a 0.95 confidence interval. This analysis shows all rivers have similar PAH fractionation fingerprints under stable conditions. This is considered a baseline PAH fraction for the region for this study. We can see that the Tar and Ells rivers display the greatest potential to deviate from the standard PAH fractionation levels. However, we also observe that the McKay and Steepbank Rivers may have a similar mixing source as the Ells during less stable periods. From this, we look at differences between the stations to see if these fingerprints are consistent within each river.
Station Groupings
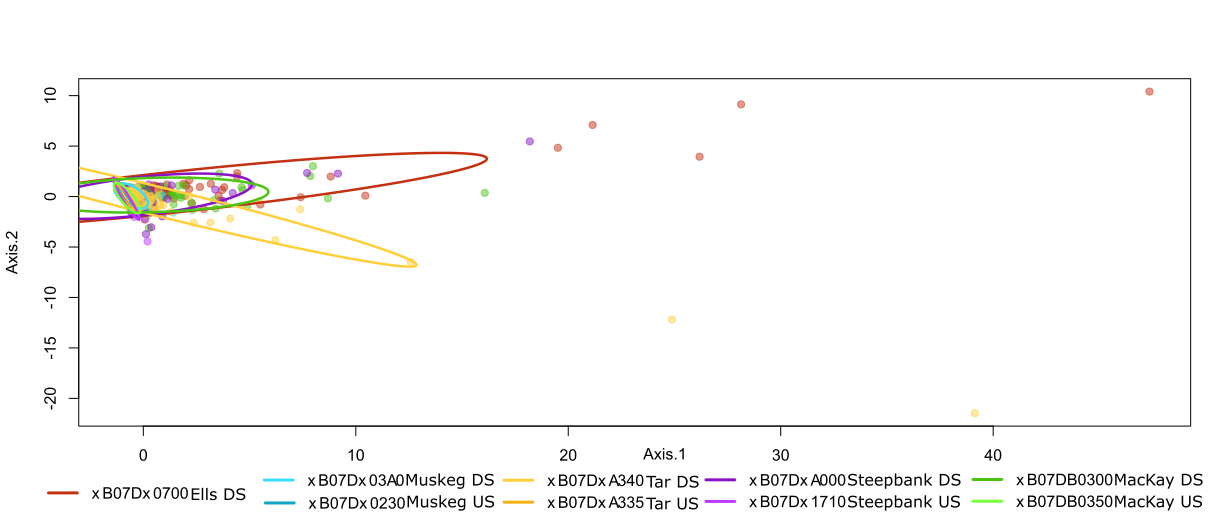
Figure 13. PCOA analysis with ellipses showing 95% confidence intervals of station groupings. Upstream (US) and Downstream (DS) stations are labeled relative to river flow. Stations are positioned above and below resource extraction facilities and outcroppings of the bitumen rich McMurray formation.
Groupings based on stations show similar characteristics to the river groups. Unsurprisingly, the single station on the Ells River shows an identical trend as demonstrated above. This ellipse is mirrored to a lesser degree by the downstream locations on the MacKay (0300) and Steepbank (1000) rivers. Within the Tar River, station 1380 is the downstream location and has a large ellipse angled along a unique trendline from other downstream sampling locations. We can see that there is extreme variation between stations in the same river. Sampling stations located above bitumen outcropping and development show little deviation from the general fractionation. This shift in fractionation shows the two end members are added to the system within the reaches of industrial development and bitumen outcropping. The differences in hydrocarbon chains suggest pyrogenic PAHs (produced from combustion) are more prevalent in the Tar River. Petrogenic PAHs (produced during organic matter decomposition) are more commonly produced in the other three variable watercourses. The large differences between all US and DS stations is also evidence that landscape carpeting from atmospheric deposition is not a major driver of pyrogenic PAH distribution. As wind direction should be a driver of industrial atmospheric loading, it was hypothesized that there would be more consistent contamination in sites located generally North and South of each other.
Monthly Groupings
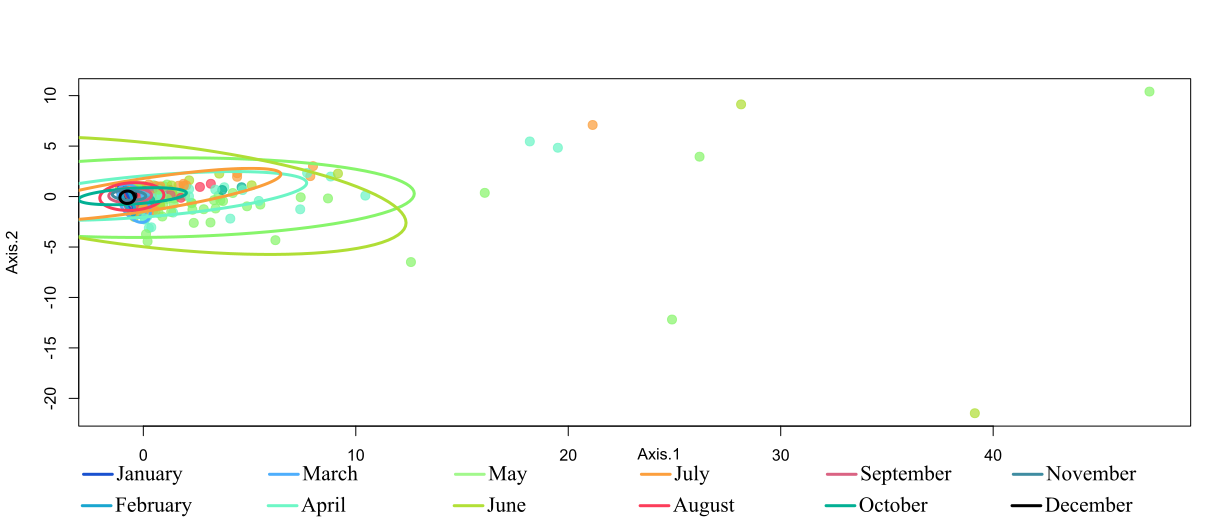
Figure 14. PCOA analysis with ellipses showing 95% confidence intervals of monthly groupings. Sampling was completed between 2015 and 2020.
Applying monthly grouping ellipses to the ordination shows that variation within PAH fractionation occurs between April and July. These trends provide evidence that freshet from snowmelt and rainy periods are a driver of the change in PAH fractionation. Open water conditions may also enhance transport of the two endmembers, however, we do not see similar deviations in the drier fall months of August to November.
Conclusion
Divisive clustering was unable to extract individual signatures from the river systems as upstream and stable downstream conditions produced similar fractionation fingerprints. However there was information still to be gained from the attempt. From the tails of the Ells and Tar rivers and the baseline we observe up to three PAH end members. From the three grouping analyses we can see both a spatial and temporal pattern to releases of these different PAHs. As detailed in the expected results, unique PAH inputs into watercourses occur as they extend through areas of industrial development and bitumen rich outcrops. Rivers richer in heavy C4 PAH hydrocarbons (e.g., Steepbank, MacKay, and Ells) indicate a petrogenic origin of additional inputs. Whether this is the result of erosion of the McMurray Formation, or additional wind erosion of coke piles remains unsure. It is of note that the Muskeg River has the longest stretch of river downcutting into the bitumen rich formation, but shows the least deviation at upstream and downstream locations. This could be a factor of channel gradient and erosional forces or may indicate better industrial management. The unique signature of the Tar River may be more indicative of petroleum upgrading (petrogenic) processes as the fingerprint is bias towards light C1 and C2 chains.
The temporal aspect of these inputs is also in agreement with the expected results. We can also see these two endmembers are mobilized over a four month period. However, as no upstream locations show a PAH deviation, it is unlikely that predominant wind effects are a driver of deposition. We can infer that rivers rich in petrogenic materials may benefit most from erosion protection measures. Also, more effective water management procedures may assist in the mitigation of these contaminants. For pyrogenic contamination in the Tar River, atmospheric loading during upgrading may be a large contributor and management of smoke particulate may be more effective.
The temporal aspect of these inputs is also in agreement with the expected results. We can also see these two endmembers are mobilized over a four month period. However, as no upstream locations show a PAH deviation, it is unlikely that predominant wind effects are a driver of deposition. We can infer that rivers rich in petrogenic materials may benefit most from erosion protection measures. Also, more effective water management procedures may assist in the mitigation of these contaminants. For pyrogenic contamination in the Tar River, atmospheric loading during upgrading may be a large contributor and management of smoke particulate may be more effective.
This analysis has been completed as part of the University of Alberta's Renewable Resources 690 - Multivariate Statistics For Environmental Sciences course. The raw data is publicly available from Alberta Environment and Parks. Analysis is preliminary and is not intended to inform management or policy directions. Neither the University of Alberta or Brandon Hill accept any risk of liability with the use or misuse of the analysis provided.
